Daily Charts Preview
These are a typical daily report set of charts. It starts with the Daily S&P Summary Report where you will find analysis of the prime indicators for 500 stocks we track daily. Alerts are next, the lines highlight the stocks having a high probability of directional movement.
The next graphic is the resulting chart based on the End-Of-Day technical analysis.
Daily S&P Summary Report
Our version of a daily report. It provides a searchable analysis of technical parameters in summary format. The user may look for a specific stock, a group of stocks within a sector or just the indexes.
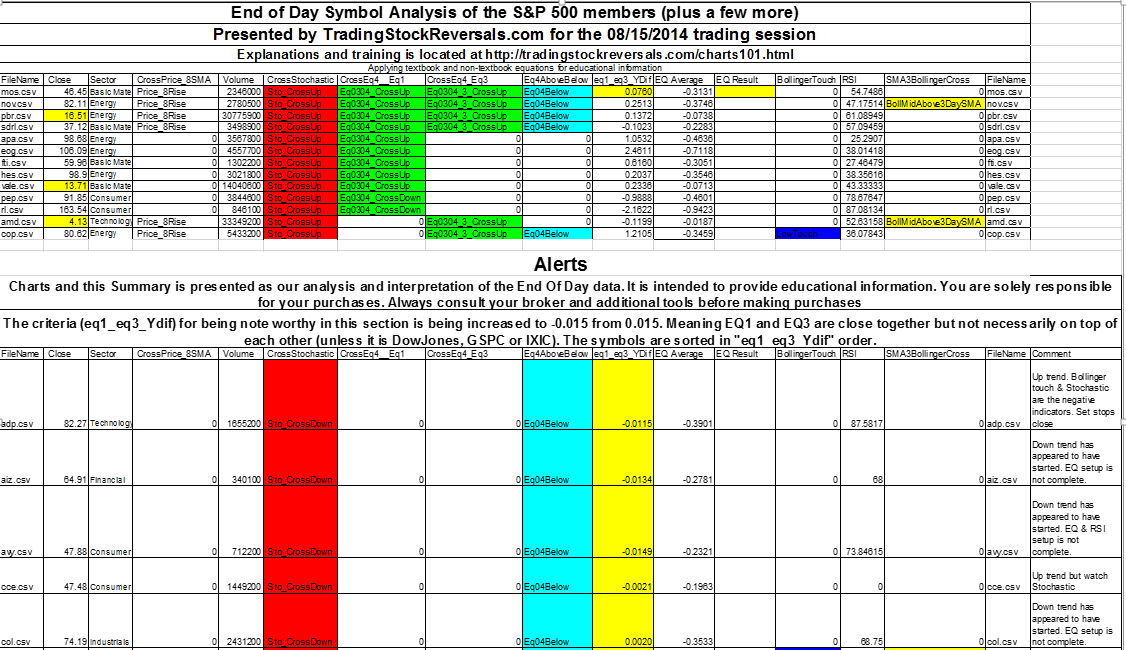
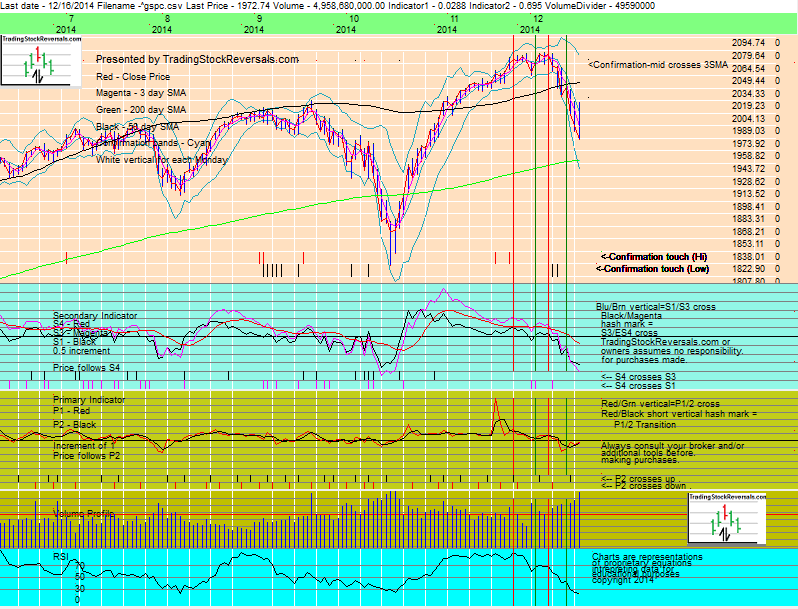
Daily Symbol Analysis Chart
The chart is a visual representation of prime indicators plotted in graph format. The user:
- Sees how the Daily Summary Report links with the indicator cross-overs.
- Watch the approaching cross-overs patterns indicating reversals and the vertical lines and the vertical lines through the 5 charts sections showing where the reversal is occurring.
Pattern interpretation guidelines
There is no mystery to what we do. We apply modified textbook and non-textbook equations to EndOfDay data.
Take the time to digest the guideline and compare the indicator characteristics to see how the they align with Price Reversals.
SUBSCRIBE NOW!